Description
Introducing the world’s first and only oscilloscope with a built-in spectrum analyzer. For the first time ever, you can capture time-correlated analog, digital, and RF signals for a complete system view of your device. See both the time and frequency domain in a single glance. View the RF spectrum at any point in time to see how it changes over time or with device state. Solve the most complicated design issues, quickly and efficiently, with an oscilloscope as integrated as your design.
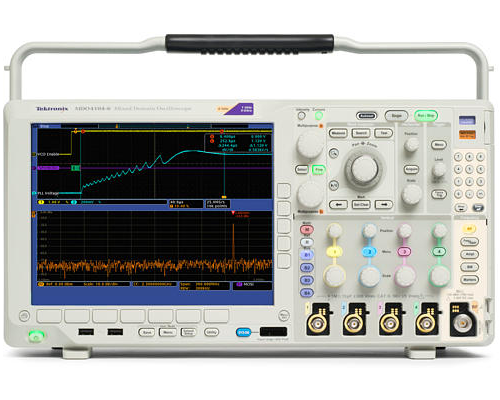
When both the RF channel and any analog or digital channels are on, the oscilloscope display is split into two views. The upper half of the display is a traditional oscilloscope view of the Time Domain. The lower half of the display is a Frequency Domain view of the RF input. Note that the Frequency Domain view is not simply an FFT of the analog or digital channels in the instrument, but is the spectrum acquired from the RF input.
The spectrum shown in the Frequency Domain view is taken from the period of time indicated by the short orange bar in the time domain view – known as the Spectrum Time. With the MDO4000 Series, Spectrum Time can be moved through the acquisition to investigate how the RF spectrum changes over time. And this can be done while the oscilloscope is live and running or on a stopped acquisition.
The time domain graticule on the MDO4000 Series display provides support for three RF time domain traces that are derived from the underlying I and Q data of the RF input including:
Amplitude – The instantaneous amplitude of the RF input vs. time
Frequency – The instantaneous frequency of the RF input, relative to the center frequency vs. time
Phase – The instantaneous phase of the RF input, relative to the center frequency vs. time
Each of these traces may be turned on and off independently, and all three may be displayed simultaneously. RF time domain traces make it easy to understand what’s happening with a time-varying RF signal.
